Julia Plots Gallery
These figures are made by Plots.jl
Home
View on GitHub
Jupyter Notebook ver.
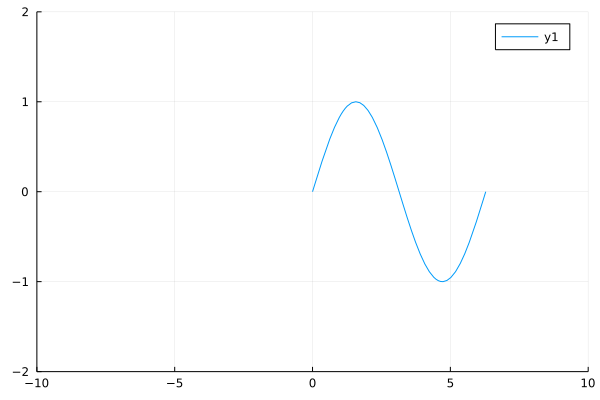
axis range
plot
(
sin
,
0
,
2
π
,
xlims
=
(
-
10
,
10
),
ylims
=
(
-
2
,
2
))
This page was generated using
Literate.jl
.