Contour plot
Contour plot
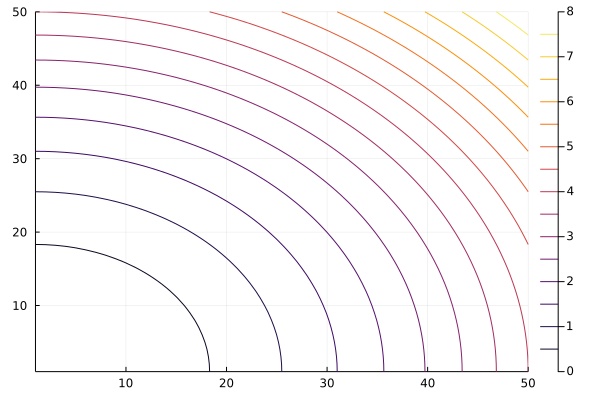
f(x,y) = x^2 + y^2
x = repeat(range(0, stop=2, length=50), 1, 50)
y = repeat(range(0, stop=2, length=50), 1, 50)'

contour( f.(x, y) )
This page was generated using Literate.jl.
f(x,y) = x^2 + y^2
x = repeat(range(0, stop=2, length=50), 1, 50)
y = repeat(range(0, stop=2, length=50), 1, 50)'
contour( f.(x, y) )
This page was generated using Literate.jl.