Histogram Plot
Histogram Plot
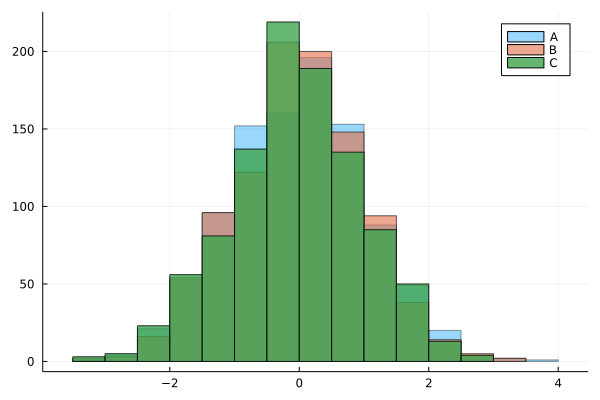
using Random
Random.seed!(2018)

x = randn(1000)
y = randn(1000)
z = randn(1000)

histogram(x, bins=20, alpha=0.4, label="A")
histogram!(y, bins=20, alpha=0.6, label="B")
histogram!(z, bins=20, alpha=0.8, label="C")
This page was generated using Literate.jl.