Adding LaTeX to plots (2)
For pyplot backend
# ref https://jp.mathworks.com/matlabcentral/fileexchange/35237-matlab-plot-gallery-adding-latex-to-plots?focused=6792946&tab=example
using LaTeXStrings, Measures
pyplot()
Plots.PyPlot.rc("text", usetex ="true")
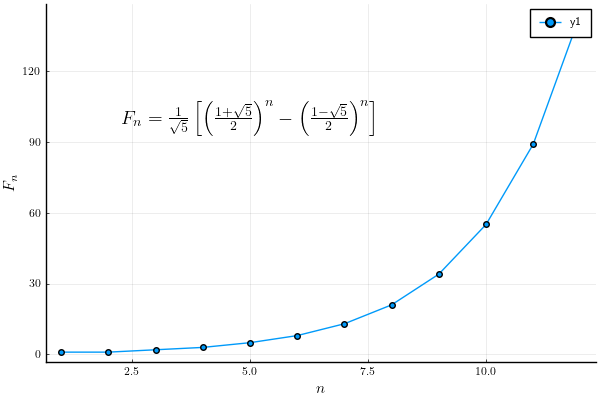
fib = zeros(12);
for i = 1:12
fib[i] = (((1+sqrt(5))/2)^i - ((1-sqrt(5))/2)^i)/sqrt(5);
end
plot(fib,
marker=:circle,
xlabel=L"n",
ylabel=L"F_n",
annotation=(5, 100, L"F_n = \frac{1}{\sqrt{5}} \left[\left( \frac{1+\sqrt{5}}{2} \right)^n - \left( \frac{1-\sqrt{5}}{2} \right)^n \right]")
)
This page was generated using Literate.jl.