polar plots
# ref https://jp.mathworks.com/matlabcentral/fileexchange/35285-matlab-plot-gallery-function-polar-plot?focused=6793167&tab=example
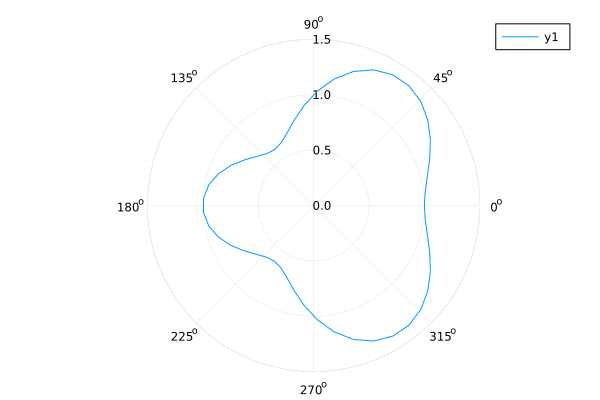
r(θ) = 1 + cos(θ) * sin(θ)^2
plot(r, 0, 2π, proj=:polar, lims=(0,1.5))
r(θ) = 1 + cos(θ) * sin(θ)^2
θ = range(0, stop=2π, length=50)
plot(θ, r.(θ), proj=:polar, lims=(0,1.5))
This page was generated using Literate.jl.