Subplot
subplot (1)
# gr()
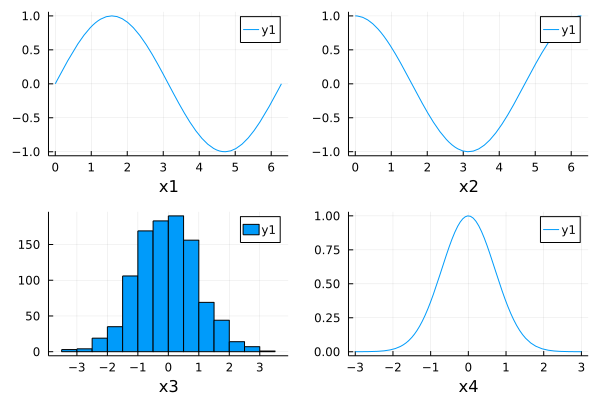
a = plot(sin, 0, 2pi, xlabel="x1")
b = plot(cos, 0, 2pi, xlabel="x2")
c = histogram(randn(1000), xlabel="x3")
d = plot(x->exp(-x^2), -3, 3, xlabel="x4")
plot(a, b, c, d)
This page was generated using Literate.jl.
# gr()
a = plot(sin, 0, 2pi, xlabel="x1")
b = plot(cos, 0, 2pi, xlabel="x2")
c = histogram(randn(1000), xlabel="x3")
d = plot(x->exp(-x^2), -3, 3, xlabel="x4")
plot(a, b, c, d)
This page was generated using Literate.jl.